Prometheus HA with Thanos and long term metric storage
Prometheus is an open-source systems monitoring and alerting toolkit and is designed to run as independent instances. Prometheus collects and stores its metrics as time series data and stores in TSDB datastore. Depending on amount of metrics and retention period, Proemetheus can become slower and require lot more resources.
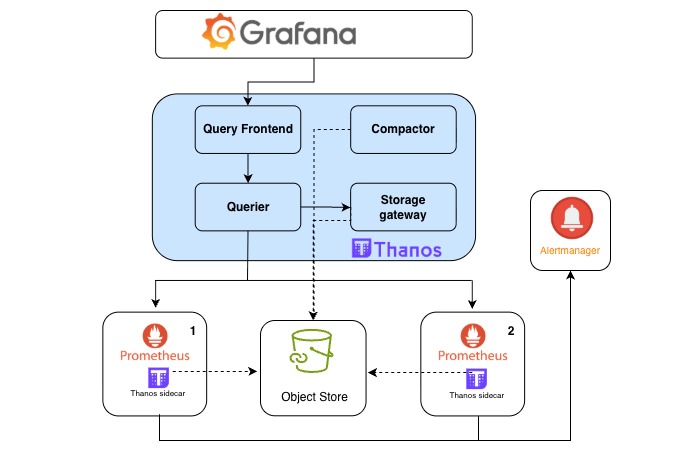
Thanos extends Prometheus's capabilities to provide High Availability (HA), global query views, and long-term metric storage at scale. It essentially transforms a single, local Prometheus server into a horizontally scalable, distributed monitoring system.
Here is how you can configure Kube-prometheus-stack with Thanos sidecar and Thanos service to enable High availability and long term storage of metrics using Prometheus.
Configure Prometheus and thanos
There are 2 parts to thanos installation.
- Configure Prometheus with Thanos sidecar and S3 bucket access.
- Install Thanos with access to Prometheus and S3 bucket/Object storage
All the source code can be found at my Github repo aws-eks-terraform
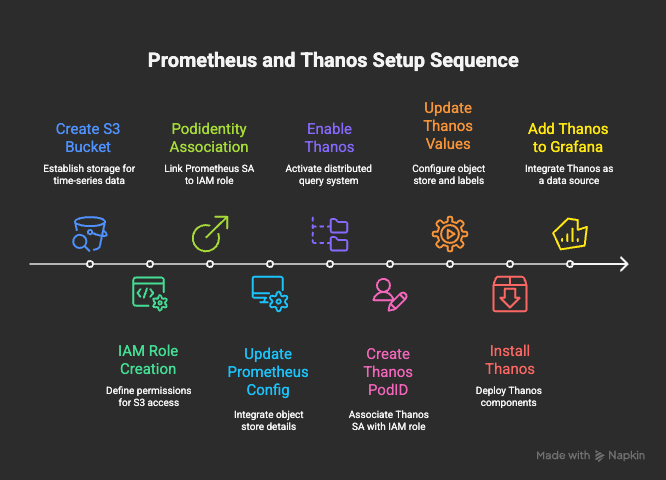
Step 1. Create S3 bucket
We need an S3 bucket to store TSDB blockes. In this example I am creating a bucket called eks-auto-demo-thanos
Step 2. Create IAM policy and Role.
Create a new IAM policy that allow write access to S3 bucket created.
prometheus-thanos-policy.json
    "Version" : "2012-10-17",
    "Statement" : [
      {
        "Sid" : "ThanosStorage",
        "Effect" : "Allow",
        "Action" : ["s3:ListBucket","s3:PutObject","s3:GetObject","s3:DeleteObject"],
        "Resource" : [
          "arn:aws:s3:*:<account-id>:accesspoint/eks-auto-demo-thanos",
          "arn:aws:s3:eu-west-1:<account-id>:accesspoint/eks-auto-demo-thanos/*"
        ]
      }
    ]
  }
prometheus-thanos-role with PODIdentity assume role. Attached previously created bucket Policy
Step 3. Create PodIdentity association.
Thanos sidecar will be deployed along with Prometheus and it require write access to S3 bucket we have created. For that we have to create a PodIdentity association that will allow Prometheus serviceAccount to assume the role we have created.
kube-prometheus-stack will be installed in monitoring namespace, so create association for serviceAccount kube-prometheus-stack-prometheus in monitoring namespace.
Step 4. Install Prometheus with Thanos
Below is minimal values.yaml file that configures thanos sidecar. Complete file available at aws-eks-terraform/EKS-Prom-Thanos/Prom-Thanos/prometheus-thanos.yaml
values.yaml
prometheus:
  enabled: true
  thanosService:
    enabled: true
  thanosServiceMonitor:
    enabled: true
    additionalLabels:
      app.kubernetes.io/instance: kube-prometheus-stack
      app.kubernetes.io/name: prometheus
  prometheusSpec:
    retention: 4h
    replicas: 2
    thanos:
      image: quay.io/thanos/thanos:v0.39.1
      version: v0.39.1
      objectStorageConfig:
        secret:
          type: S3
          config:
            bucket: "eks-auto-demo-thanos"
            region: "eu-west-1"
            endpoint: s3.amazonaws.com
            insecure: false
            signature_version2: false
            put_user_metadata: {}
            http_config:
              idle_conn_timeout: 90s
            trace:
              enable: false
      listenLocal: false
objectStorageConfig with necessary parameters, a new secret with its content will be created for Thanos sidecar to consume.
Install Prometheus
helm upgrade -i kube-prometheus-stack \
--repo https://prometheus-community.github.io/helm-charts kube-prometheus-stack  \
-n monitoring --create-namespace -f prometheus-thanos.yaml
Step 4. Create PodIdentity association for Thanos service
Multiple Thanos services require access to the S3 bucket to function. Thanos gateway reads TSDB contents, compactor deduplicate and compacts contents on Bucket. Since we are using Pod Identity,we can reuse IAM role created previously.
Thanos will be installed in thanos Namespace, create following podID association to role prometheus-thanos-role
- SA=thanos-storegateway, NS=thanos
- SA=thanos-compactor, NS=thanos
Step 5. Install Thanos
Here is minimal thanos.yaml file. For more detailed file refer aws-eks-terraform/EKS-Prom-Thanos/Prom-Thanos/thanos.yaml
In this configuration I am installing following components
- Thanos querier
- Thanos query front end
- Thanos storage gateway
- Thanos compactor
thanos.yaml
global:
  defaultStorageClass: "gp3"
  # Insecureimagesoption required as chart defaults to Bitami's private registry that are no longer available.
  security:
    allowInsecureImages: true
image:
  registry: docker.io
  repository: thanosio/thanos
  tag: v0.40.1
objstoreConfig: |
  type: S3
  config:
    bucket: "eks-auto-demo-thanos"
    region: "eu-west-1"
    endpoint: s3.amazonaws.com
    insecure: false
    signature_version2: false
    put_user_metadata: {}
    http_config:
      idle_conn_timeout: 90s
    trace:
      enable: false
query:
  enabled: true
  replicaCount: 1
  replicaLabel: prometheus_replica  # Thanos default is 'replicas' label used by kube-prom is this.
  dnsDiscovery:
    enabled: true
    sidecarsService: kube-prometheus-stack-thanos-discovery # SVC of the sidecar
    sidecarsNamespace: monitoring

  extraArgs:
    - "--log.level=info"
    - "--query.replica-label=replica"
    - "--store=dnssrv+_grpc._tcp.kube-prometheus-stack-thanos-discovery.monitoring.svc.cluster.local"
storegateway:
  enabled: true
  replicaCount: 1
  extraArgs:
    - "--sync-block-duration=3m"
    - "--objstore.config-file=/conf/objstore.yml"
compactor:
  enabled: true
  retentionResolutionRaw: 30d
  retentionResolution5m: 90d
  retentionResolution1h: 180d
  extraArgs:
    - "--objstore.config-file=/conf/objstore.yml"
    - "--wait"
queryFrontend:
  enabled: true
  replicaCount: 1
  extraArgs:
    - "--query-range.split-interval=24h"
    - "--query-range.response-cache-max-freshness=1m"
Install Thanos
# Add Bitnami repo and install thanos
helm repo add bitnami https://charts.bitnami.com/bitnami ; helm repo update bitnami
helm install thanos bitnami/thanos --version 17.3.1 -f thanos.yaml -n thanos --create-namespace
thanos-query-frontend.thanos.svc.cluster.local:9090
[!NOTICE] It can take more than 2 hours before data is visible in S3 bucket. Data is uploaded only when Prometheus closed a TSDB file which by default every 2 hours
Step 6. Configure Grafana Datasource
In Grafana datasources, you can now create a new data source type Prometheus and point it to Thanos-frontend service if in same account, or its Ingress/HttpRoute
When performing queries, last 4 hours data will be retrieved from Prometheus and older data will be retrieved from S3 bucket via storage Gateway
Fixing dedupilcation
Querier must identify the label used by each prometheus to distinguish prometheus instances.
By default label replica is used. If using kube-prometehus-stack, update it to "--query.replica-label=prometheus_replica"
Thanos receiver
Receiver implements Prometheus remote write interface and can be used to centralize logs from multiple Prometheus instances. If receiver is accepting traffic via Loadbalancer, make sure Loadbalancer and ingress/Gateway are configured to use HTTP 1.1, receiver does not work with HTTP 2.0
[!WARNING] Receiver only accepts HTTP 1.1, if using LB, ensure HTTP 2.0 is disabled for receiver traffic
Prometheus Topology spread
If running more than one Prometheus, it is advised to run in different zones to ensure zone faulure does not disrupt your monitoring. Configure following to enable podspread across zones
prometheus:
  prometheusSpec:
    podAntiAffinity: ""   #Must leave it blank so that kube-prom does not create anti-affinity.
    topologySpreadConstraints:
      - maxSkew: 1
        topologyKey: topology.kubernetes.io/zone
        whenUnsatisfiable: DoNotSchedule
        labelSelector:
          matchLabels:
            prometheus: kube-prometheus-stack-prometheus
Thanos components summary
| Component | Purpose |
|---|---|
| ✅ Query-Front-end | (optional) Adds caching, better UI performance. |
| ✅ Query | Aggregates metrics from Prometheus sidecars and StoreGateway |
| ✅ StoreGateway | Reads historical blocks from S3 |
| ✅ Compactor | Deduplicates and compacts blocks in S3 |
| ⚙️ Optional: Ruler | Allows rule evaluation based on S3 data |
| ❌ Bucketweb | Usually not needed in production |